How far can a single event influence community behavior?
Now let’s take a look at the dataset.
Dataset
The network is directed, signed, temporal, and attributed.
As a complement, we will utilize subreddit embeddings, vector representations of each subreddit. They were created such that community embeddings will be close together if similar users post on them.
Clustering
Modularity
Modularity is a measure of how well a network is partitioned into groups (or communities). Given a partition of the network into groups. The Modularity of a partitioning S of graph G is : $$ Q = \frac{1}{2m} \sum_{ij} \left( A_{ij} - \frac{k_i k_j}{2m} \right) \delta(c_i, c_j) $$ Where $A_{ij}$ is the edge weight between nodes $i$ and $j$, $k_i$ and $k_j$ are the sum of the weights of the edges attached to nodes $i$ and $j$, $2m$ is the sum of all the edge weights in the graph, $c_i$ and $c_j$ are the communities of the nodes and $\delta$ is an indicator function.Leiden Algorithm
To identify communities by maximizing modularity, we can use the Leiden algorithm which is an improvement of the Louvain algorithm. It guarantees well-connected communities, converging towards a partition in which all subsets of all communities are locally optimally assigned and it is much faster than Louvain.Here are the clusters we found.
How to plot embeddings?
These vector embeddings are actually 300 dimensional! To make a nice plot, we first need to reduce the dimensionality. This step keeps the most important structure in the data while projecting everything down to two dimensions.PCA
We start with PCA (Principal Component Analysis). PCA is a linear method that finds the directions in the data with the most variance and projects the embeddings onto those directions. Using PCA helps compress the embeddings and remove some noise, and it also makes later visualization steps faster and more stable.t-SNE
After PCA, we use t-SNE to create the final 2D visualization. t-SNE works by turning similarities between subreddits into probabilities and then trying to preserve those similarities in a lower-dimensional space. It does this by minimizing the Kullback–Leibler divergence between the original high-dimensional data and the 2D embedding. We apply PCA first because the original embeddings have a lot of features, and t-SNE doesn’t work well when the dimensionality is too high.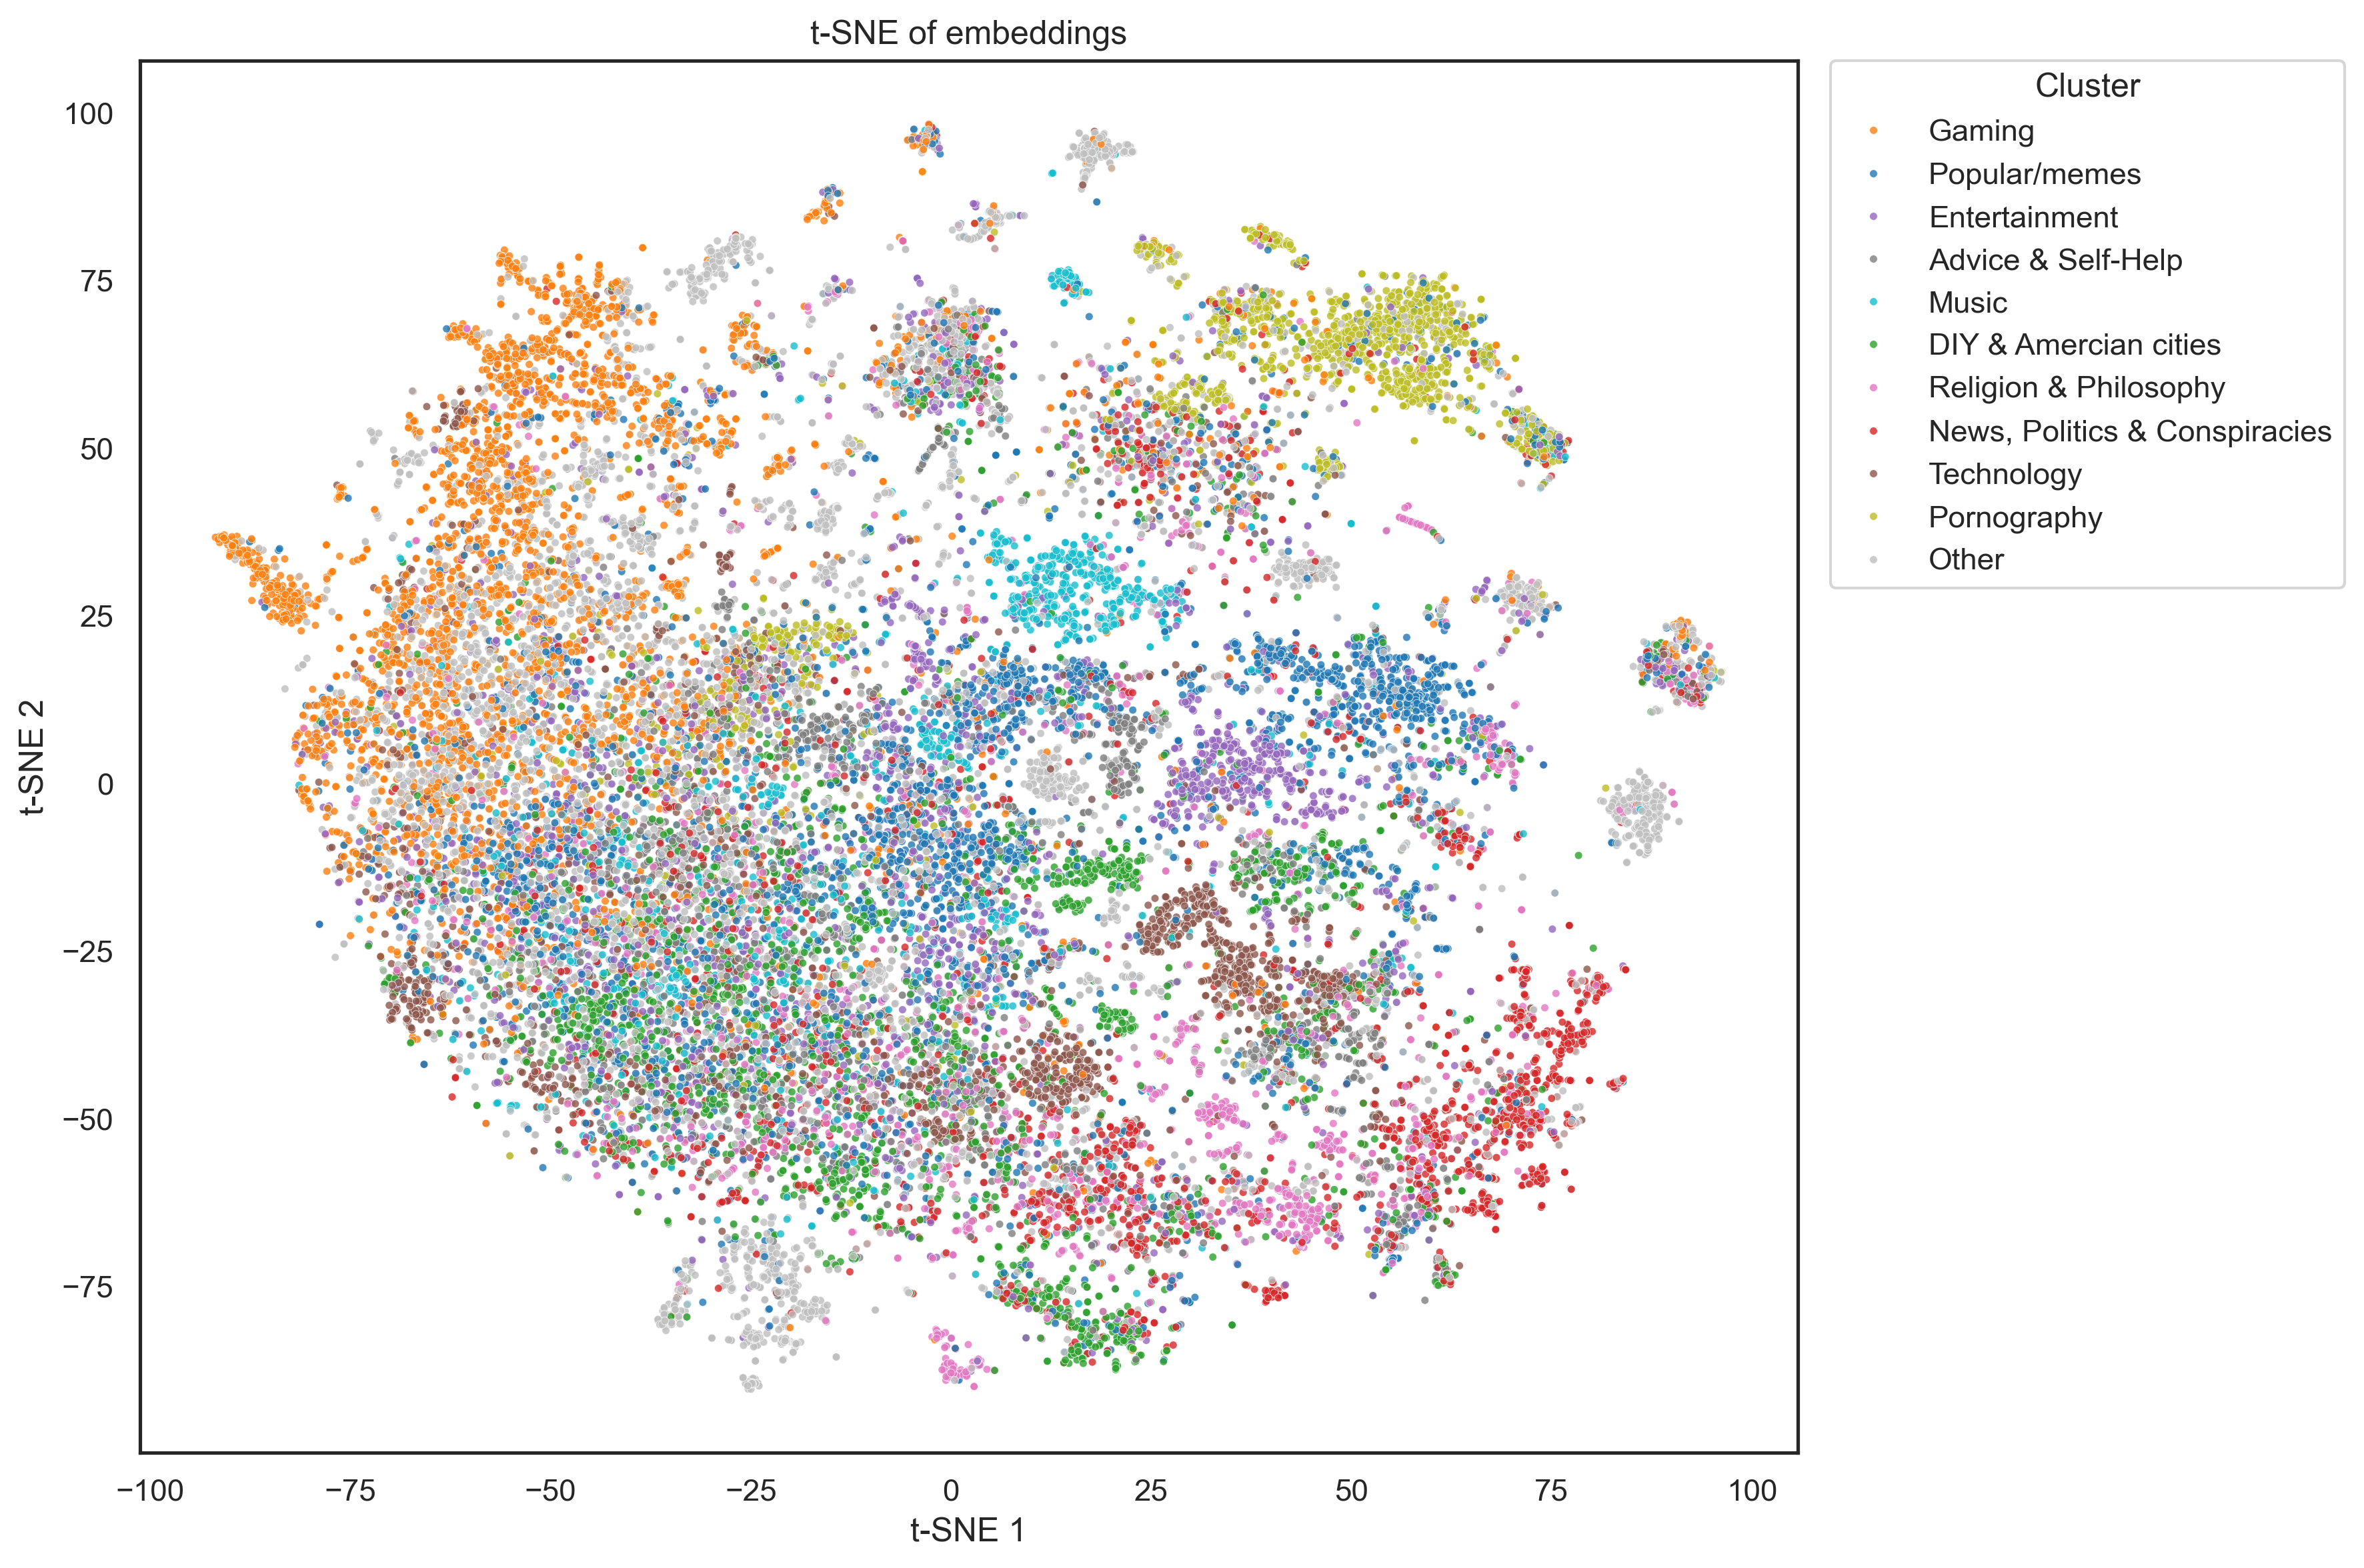
t-SNE projection of subreddit embeddings. Each dot represents a community; clusters indicate shared topical interests and interaction patterns.
This makes sense because although subreddits in these might link each other often (eg: r/capitalism and r/communism) this does not mean that their users will be similar, leading to a spread out group in embedding space.
We can also analyse which clusters communicate the most between each other.
Sentiment analysis
What is the share of positive to negative hyperlinks and how can we define them? The data is labeled with a link sentiment value which is either +1 if the post is neutral to positive or -1 if the post is negative.The authors of the paper originally had three categories: positive, negative, and neutral but they had so few positives that they combined them with the neutral class.
Let's look at the distribution of link sentiment in the dataset.
We combine the LIWC and VADER outputs into a single signed sentiment score using principal component analysis (PCA). PCA is applied directly to the LIWC and VADER features, and the first principal component, which captures the dominant shared variation across the lexicon-based measures, is used as a continuous sentiment axis. This signed score provides a compact measure of sentiment polarity and strength, enabling rapid assessment and comparison of sentiment intensity across posts.
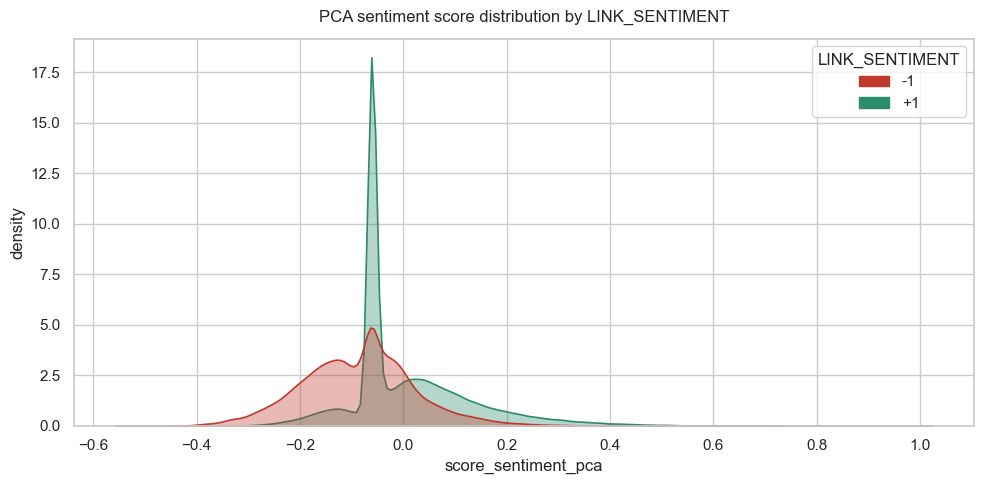
The large spike near zero represents hyperlinks with neutral metrics, effectively identifying objective or non-emotive content.
Loadings
To answer this, we can look at the PCA loadings for the first principal component. A loading tells us how much each original feature contributes to that component. Features with larger absolute values matter more, because they have a bigger influence on the direction of the component. They show how strongly each feature lines up with the main axis of variation in the data.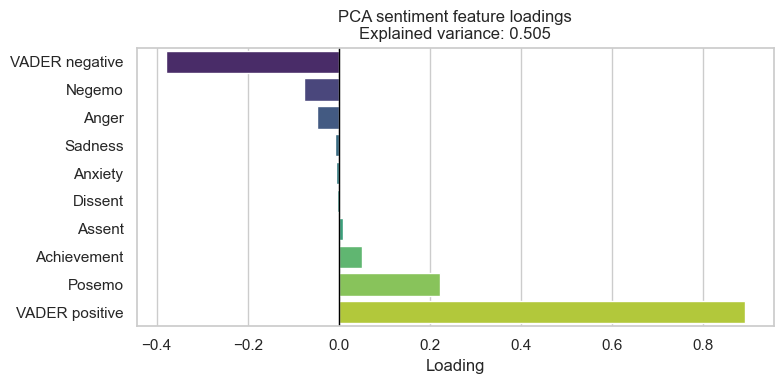
Most of the sentiment signal comes from overall positive and negative tone, with finer-grained emotions playing a much smaller role.
What are Shock Events?
-
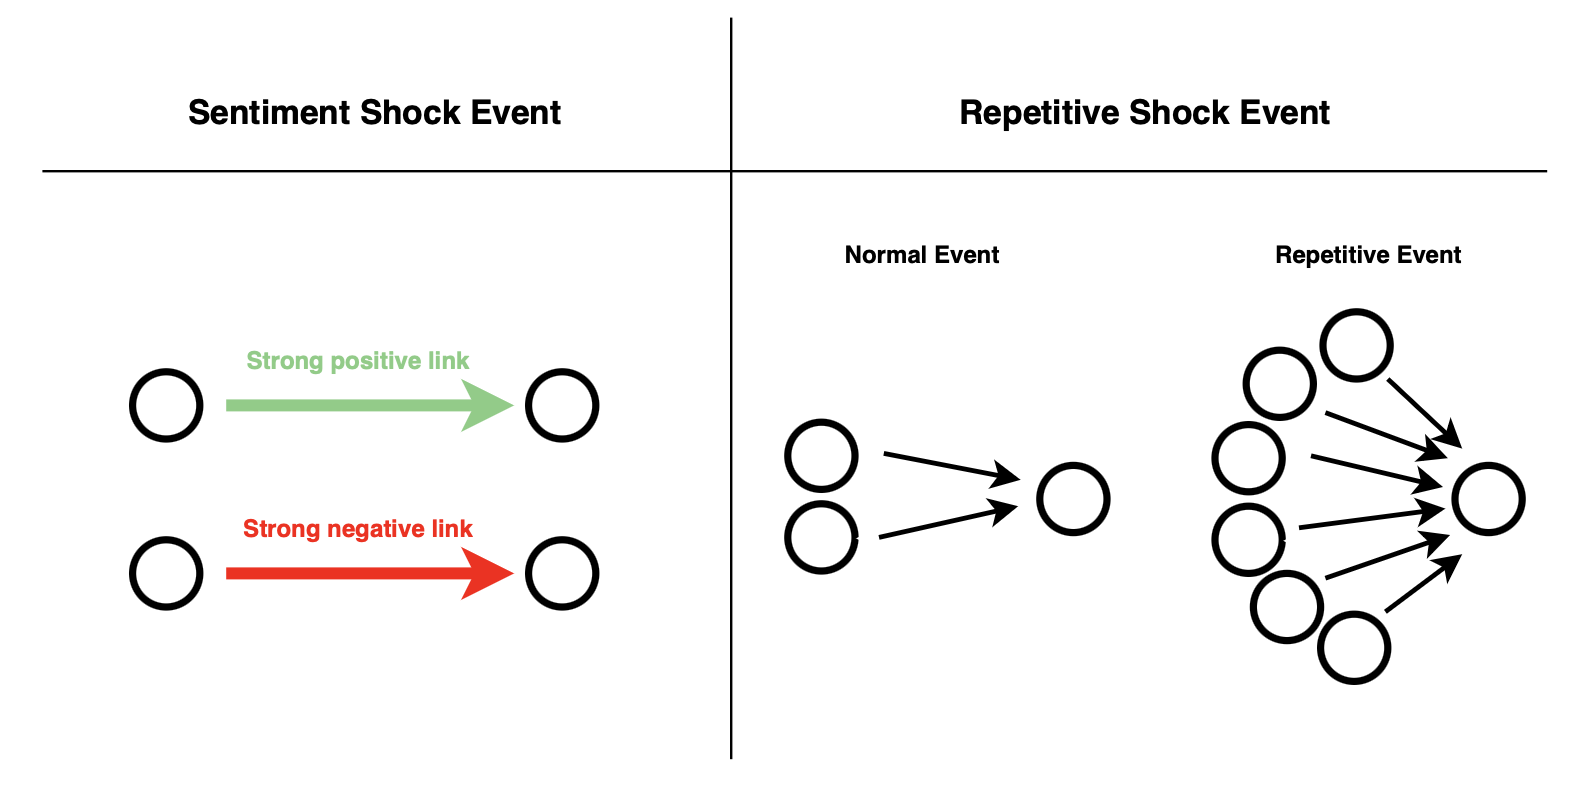
In our framework, we decided to define two particular cases of shock events:
- Sentiment Shock Event: A sentiment shock event happens when a subreddit receives an incoming link with sentiment that is unusually extreme, either negative or positive, compared to what it normally receives. These moments stand out from everyday activity as spikes in emotional intensity.
- Repetitive Shock Event: A repetitive shock event happens when a subreddit receives unusually large bursts of incoming links several times in a short period, compared to its normal past activity.
So what happens after a sentiment shock event ?
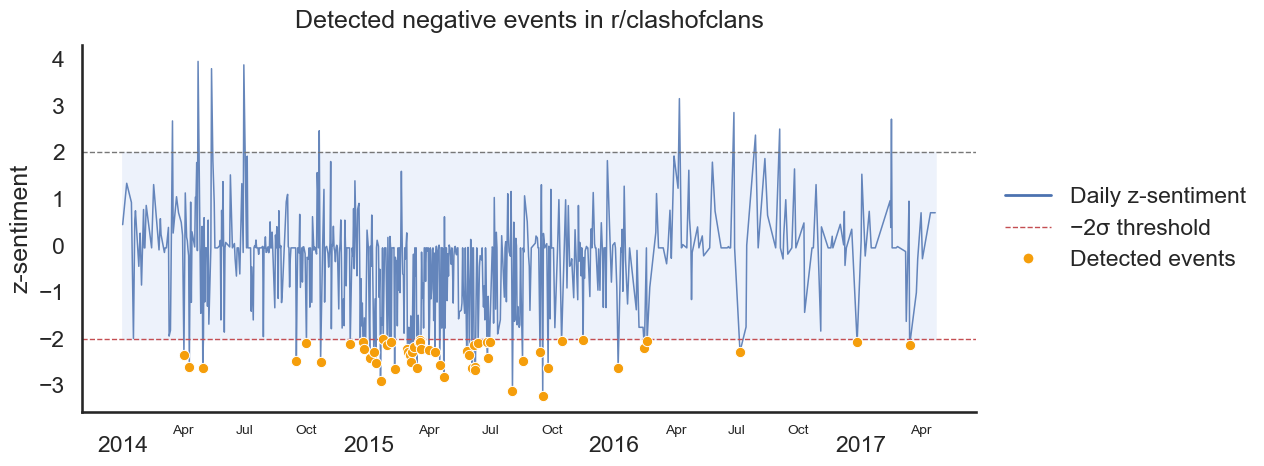
Detected negative events for r/clashoflclans. Orange points mark days where the negative deviation is strong enough to be classified as an event.
How is the standardized score computed?
For a subreddit s, let $x_{s,t}$ denote the sentiment score of an incoming interaction observed on day $t$. We compute the standardized score as: $$ z_{s,t} = \frac{x_{s,t} - \mu_s}{\sigma_s} $$ where:
- $\mu_s$ is the mean incoming sentiment for subreddit s,
- $\sigma_s$ is the corresponding standard deviation.
So, how do we test for a snowball effect?
- We collect all outgoing links written by subreddit s in a short time window before and after the event day t.
-
We compare the distributions of the continuous sentiment score
(
score_sentiment_pca) in the pre- and post-event windows. - To account for unequal variances and sample sizes, we use Welch’s t-test, which yields a p-value quantifying whether the change is statistically significant.
Welch’s t-test
Welch’s t-test is used to determine whether the difference between the means of two groups is due to random variation or reflects a real difference between the populations, particularly when the variances of the groups are unequal. The test works by computing a t-value that relates the difference in sample means to the variability in the data. Welch’s t-test defines the statistic \( t \) by the following formula: \[ t = \frac{\Delta \bar{X}}{s_{\Delta \bar{X}}} = \frac{\bar{X}_1 - \bar{X}_2}{\sqrt{s_{\bar{X}_1}^2 + s_{\bar{X}_2}^2}}, \] with: \[ s_{\bar{X}_i} = \frac{s_i}{\sqrt{N_i}}. \] Here, \(\bar{X}_i\) and \(s_{\bar{X}_i}\) denote the \(i\)-th sample mean and its standard error, respectively. The quantity \(s_i\) represents the corrected sample standard deviation, and \(N_i\) is the sample size. Unlike Student’s t-test, the denominator is not based on a pooled variance estimate. The degrees of freedom \(\nu\) associated with this variance estimate are approximated using the Welch–Satterthwaite equation: \[ \nu \approx \frac{\left(\frac{s_1^2}{N_1} + \frac{s_2^2}{N_2}\right)^2} {\frac{s_1^4}{N_1^2 \nu_1} + \frac{s_2^4}{N_2^2 \nu_2}}, \] where: \[ \nu_i = N_i - 1. \]P-Value
A p-value is the probability of seeing a result at least this extreme if the null hypothesis were actually true. Smaller p-values mean the result is less likely to be just random variation.For our tests, we compare it to a threshold with value 0.05: below that, we call the result statistically significant and reject the null hypothesis.
Let's see what results we get...
Positive shock events
Negative shock events

Even Monet looks unsure here.
In these waffle plots we are hunting for what could be the beginning of a snowball effect. We try to observe if after a subreddit takes a hit (or a praise), there would be a change in the sentiment of its outgoing links.
Something stands out from these plots! The proportion of events where we compute a significant shift in the sentiment of the outgoing links, is really small compared to the overall events. Therefore, we cannot make any generalization on the shift of the sentiment after such events.
Details
Outgoing count shifts after negative events
Outgoing count shifts after positive events
What can we tell about these events?
First, let's see how our detected events are distributed withing the different topical clusters. Is the reaction conditioned on the type of subreddit? Do some subreddits react more positively or more negatively? Let's take a look.What about the strength of the incoming link: does a larger sentiment score impact the reaction even within the events we already classified as strong?
Ordinary Least Squares Regression (OLS)
Details
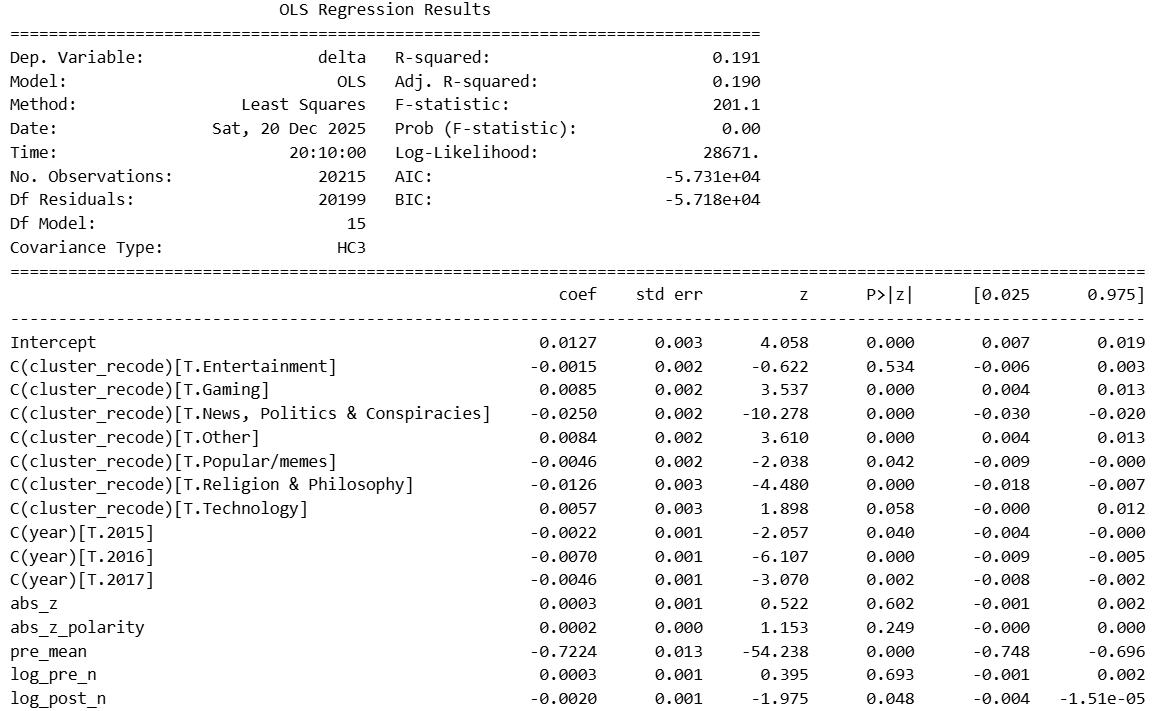
Once we account for a subreddit’s prior sentiment level, most of the variation in how it reacts is explained by regression to the mean: subreddits that were already highly positive tend to cool off, while more negative ones tend to rebound. Topic still matters, but only at the margins. News, politics, and conspiracy-focused communities show systematically weaker reactions, while gaming-related subreddits tend to react slightly more positively on average. By contrast, the strength of the incoming sentiment signal (how extreme it is) adds little explanatory power once the baseline is known. In other words, where a community starts matters far more than how emotionally charged the triggering content is.
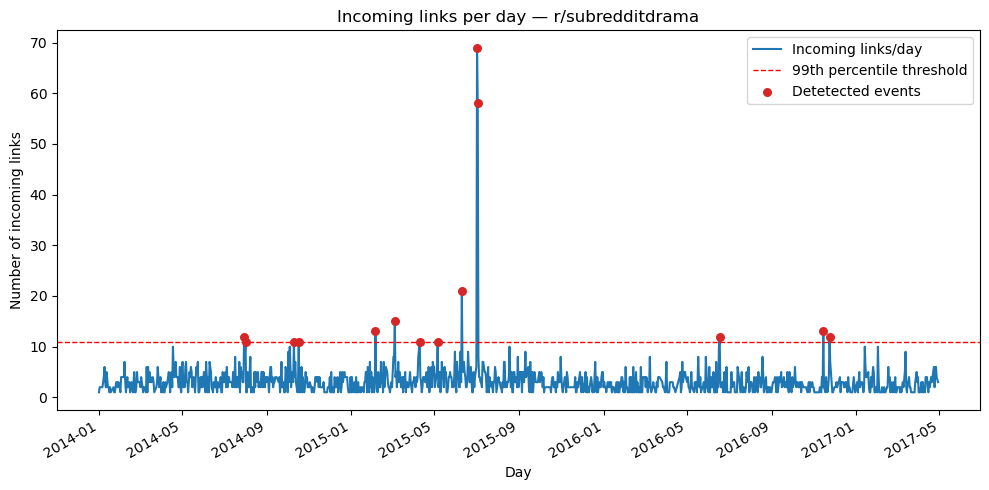
What about the repetitive shock events?
In simple terms, a day is labeled as a shock event when a subreddit receives a surge of incoming links that is rare compared to its past, much larger than its usual activity, and large enough in absolute size to be meaningful.
Formal Definition
For each subreddit s, we define a threshold that determines when incoming links are unusually high: \[ \text{threshold}_s = \max \left( \text{percentile}_{s,q},\ k_0 \right) \] A day is labeled as a repetitive shock event if the number of incoming links exceeds this threshold.- percentileₛ,q: captures rare events by focusing on the extreme tail of historical activity (we use q = 0.99).
- k₀: avoids triggering events for very small subreddits due to noise (we use k₀ = 5 links).
How strict is this detection?
The detection is intentionally strict: most days have very little activity (often just one link for a subreddit), so we only flag truly unusual spikes and end up marking just a small fraction of time bins as shock events. After performing parameter sweeping and qualitative inspection, we selected a baseline configuration that best represents meaningful repetitive linking activity.- Time window: 1 day
- Percentile threshold (q): 0.99
- Minimum absolute threshold (k₀): 5 links
- Decision rule: thresholdₛ = max(percentileₛ,q, k₀)
r/SubredditDrama is one of these reddits where people collect and retell the funniest and most chaotic fights happening across Reddit, so you can follow the drama without being part of it. We decided to show you that subreddit's activity (number of times it has been hyperlinked per day) to bettter understand how we detect these events.
Details
Once these repetitive shock events are detected for every subreddit, we apply the same logic as done for our sentiment events. We compare a subreddit’s behavior before and after to answer the following questions:
- Does the sentiment of outgoing and incoming links change?
- Does the volume of outgoing and incoming links increase or decrease?
So, we measured shifts on each metric and ran the same Welch-style t-tests as before to see whether these bursts produced any statistically significant movement for each detected event. You can see below our results ...
Only a sliver of shocks show up as significant, and when they do it’s mostly in incoming metrics than outgoing ones. Note that “untested” wedges are just days with no usable links around the shock, so there was no sentiment to measure.
Apparently Monet was seen losing his mind somewhere in France in the search for a snowball effect. Let’s not give up now; we still have one card left.
Click here to see the details !
But does it spread?
We use our highly emotional detected events as seeds, potential starting points of emotional diffusion.

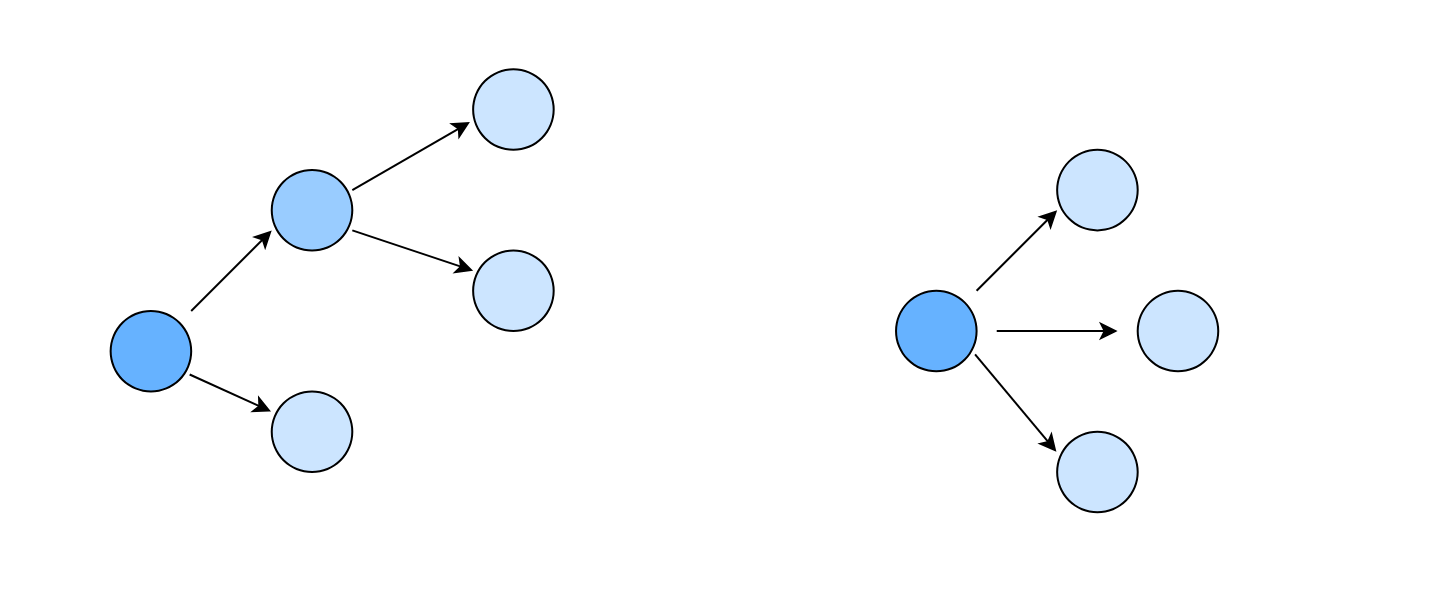
Network distance
Network distance is a measure that quantifies the separation between two nodes in a network as the length of the shortest path connecting them, where length is defined as the minimum number of edges required to traverse from one node to the other.Metrics
- Reach:
Number of subreddits that show an emotional shift after the seed event - Radius:
Maximum network distance between the seed subreddit and affected subreddits
Considering the seed as the first subreddit who started the shock event, we focused on all the subreddits which have been linked by it in the defined short timespan after the highly emotional event. As earlier, we try and observe if their average outgoing link sentiment has a significant change in value.
So, what have we learned?

Which might actually be good news!🥳
There are many ways in which users interact! If you are interested in the way negative hyperlinks can create mobilizations where users from a source subreddit and how users from that target react after an attack, check out the paper below.
Read the paper